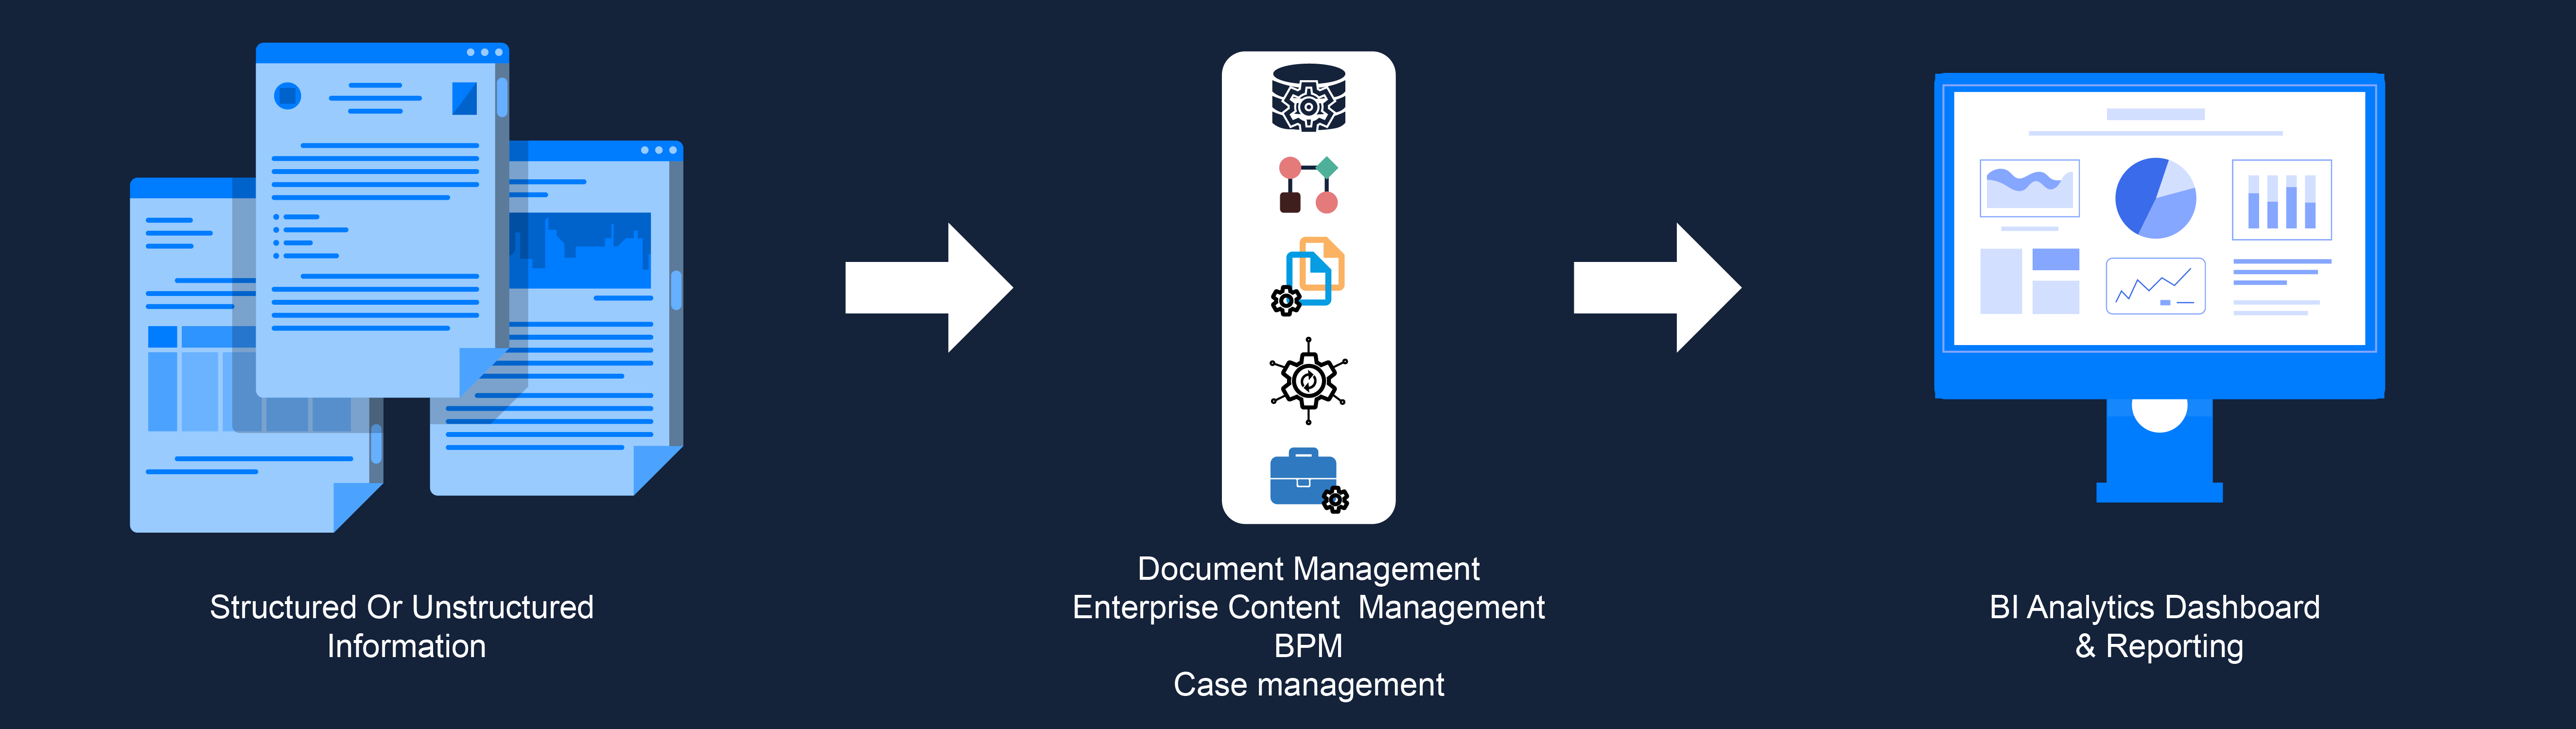
The BI Dashboard & Reporting, developed by SoluSoft, helps to improve day-to-day decision-making and to simplify the data driven decision making by presenting the important business information in various formats. This is a comprehensive solution that provides real time information to critical business performance indicators to improve the effectiveness and efficiency of business operations, processes and transactions. It is a single integrated platform where information can be propagated from any information source and be delivered to top management executives to lower level employees, departments, and even to layman to experts, and automate business processes.
BI Dashboard & Reporting is a core component of SoluSoft Business Process Digital Transformation Solution Suite. This captures end-to-end transactions and transactional data across multiple application servers. It summarizes and displays metrics to users with several reporting and activity monitoring views to help managers make informed decisions. The application provides dynamic reports powered by events, real-time and rule-based parameters. These reports give insight to key performance indicators (KPIs), cause analysis of business problems and alerts of impending problems. The organization benefits from making better informed business decisions, address problem areas quickly, take corrective measures and leverage the advantage of emerging opportunities.
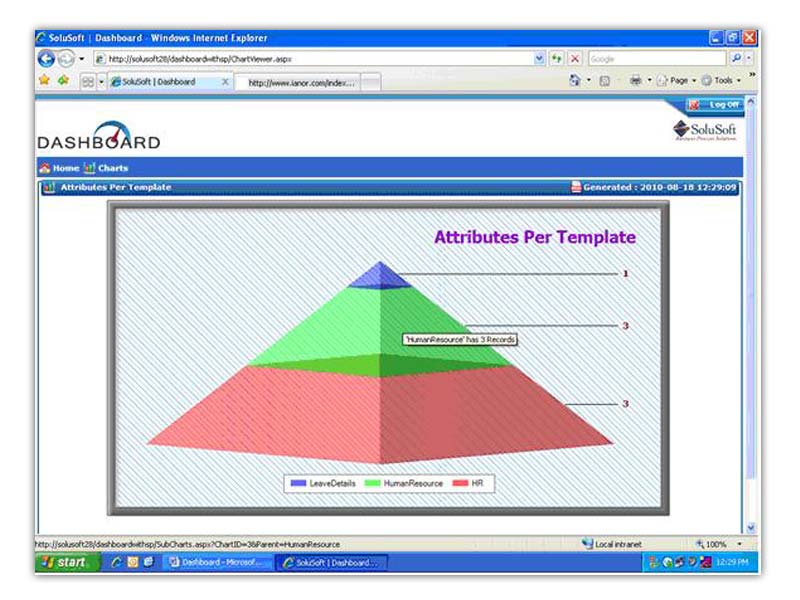
• Sophisticated Data Analysis: Dashboard offers advanced tools for data analysis and drill-sown. It gives the flexibility to customize different types of charts and reports. Users can generate several types of charts in 2D and 3D modes.
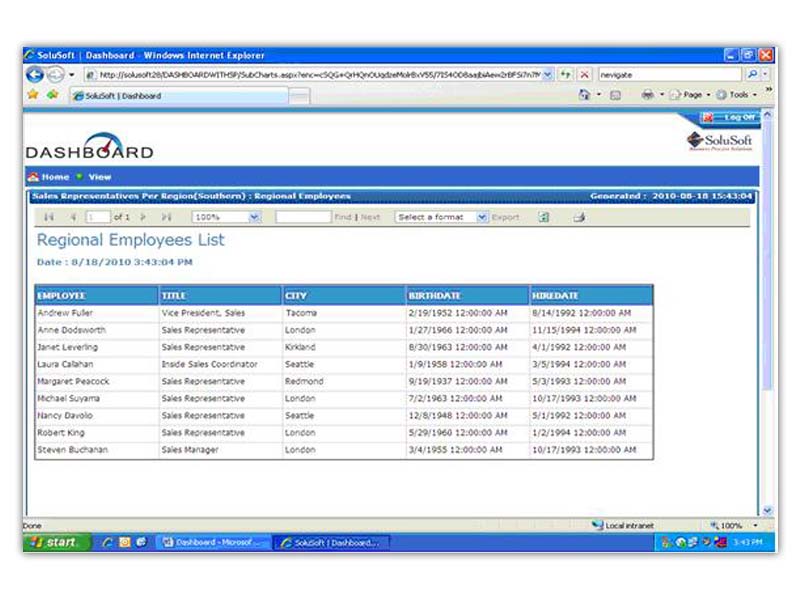
• User-friendly GUI: The application has a simple UI with customizable drop downs for data analysis parameters. Users can define combination of attributes to generate custom reports and charts. Dashboard empowers business users to monitor, explore, and analyze to drilldown visual data for further analysis.
• Database Connectivity: The solution is capable of providing integrated view of all the data from multiple relational databases. The application allows users to generate charts and reports across various data sources. Administrator can write SQL queries to populate charts and reports. It provides visibility, measurement, and assurance of key business activities to the decision makers.
• Customized Query Builder: Dashboard has an in-built query builder using which users can write custom queries. Charts & reports can be customized for color, fonts, text, axis scale, background, grid, type, labels and more. It provides the flexibility to modify all the elements for customized output. In fact there are over 240 different customizable chart attributes. Advanced features include data drill-down for further elementary analysis.
• Scorecards: Dashboard acts as a performance management application which allows monitoring, measuring, and managing performance by tracking metrics. It provides the edge to organization by providing insight about exceptions, actionable business intelligence, key performance indicators, performance metrics and more.
• Access to Enterprise Data: It provides secure access to underlying databases for customized view of performance for user groups. Charts & reports can be derived by analyzing multiple databases which can be shared across the user groups.
• Data Export/Import: This option lets users select the report type for export of charts, reports and templates. Data can be imported by the users also.
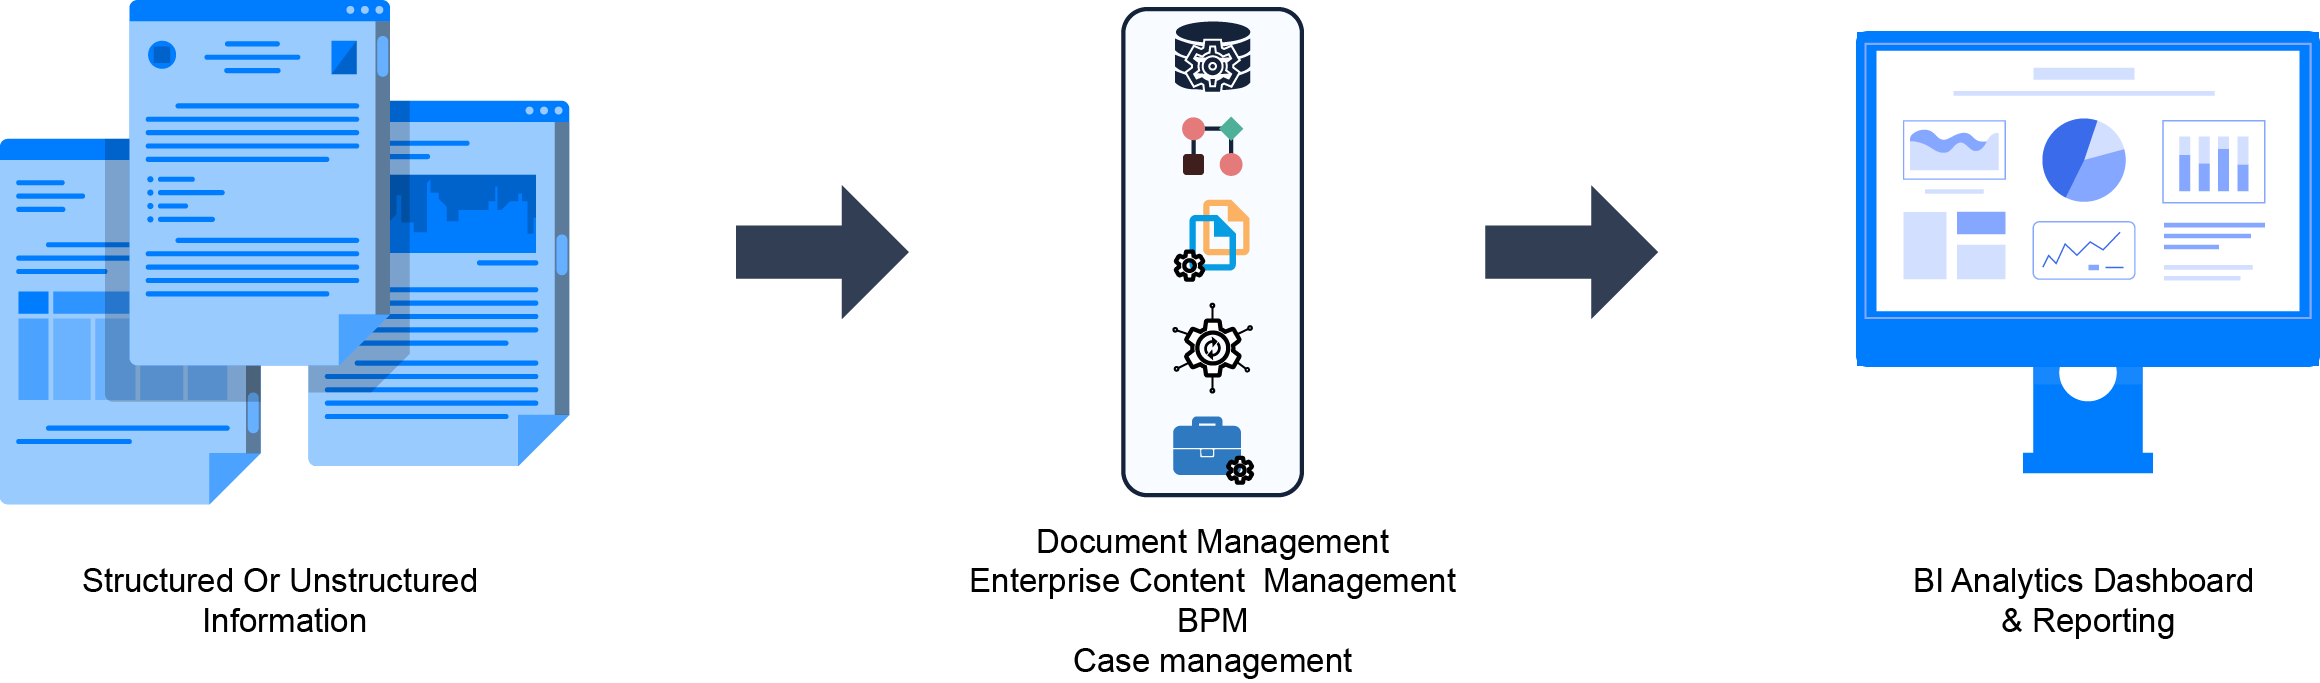
The BI Dashboard & Reporting, developed by SoluSoft, helps improve day-to-day decision-making and simplifies data-driven decision-making by presenting important business information in various formats. This is a comprehensive solution that provides real-time information on critical business performance indicators, enhancing the effectiveness and efficiency of business operations, processes, and transactions. It is a single integrated platform where information can be sourced from any data source and delivered to top management executives, lower level employees, departments, and even to layman to experts, and automating business processes.
The BI Dashboard & Reporting is a core component of SoluSoft's Business Process Digital Transformation Solution Suite. It captures end-to-end transactions and transactional data across multiple application servers, summarizing and displaying metrics to users through various reporting and activity monitoring views to assist managers in making informed decisions. The application generates dynamic reports driven by events, real-time and rule-based parameters. These reports provide insights into key performance indicators (KPIs), root cause analysis of business problems and alerts regarding impending issues. The organization benefits from making better-informed business decisions, addressing problem areas promptly, taking corrective measures, and capitalizing on emerging opportunities.
• Sophisticated Data Analysis: The Dashboard offers advanced tools for data analysis and drill-down. It provides the flexibility to customize various types of charts and reports. Users can generate multiple types of charts in both 2D and 3D modes.
• User-friendly GUI: The application features a simple user interface (UI) with customizable drop-down menus for data analysis parameters. Users can define combinations of attributes to generate custom reports and charts. The Dashboard empowers business users to monitor, explore, and analyze visual data for further in-depth analysis.
• Database Connectivity: This solution is capable of providing an integrated view of all the data from multiple relational databases. The application allows users to generate charts and reports across various data sources. Administrators can write SQL queries to populate charts and reports. It provides visibility, measurement, and assurance of key business activities for decision-makers.
• Customized Query Builder: The Dashboard includes an in-built query builder that allows users to write custom queries. Charts and reports can be customized for color, fonts, text, axis scale, background, grid, type, labels, and more. It provides the flexibility to modify all elements for customized output. In fact, there are over 240 different customizable chart attributes. Advanced features include data drill-down for further elementary analysis.
• Scorecards: The Dashboard acts as a performance management application, enabling monitoring, measuring, and managing performance by tracking metrics. It provides organizations with insights into exceptions, actionable business intelligence, key performance indicators, performance metrics, and more.
• Access to Enterprise Data: It provides secure access to underlying databases for a customized view of performance for user groups. Charts and reports can be derived by analyzing multiple databases, which can then be shared across user groups.
• Data Export/Import: This option lets users select the report type for export of charts, reports and templates. Data can be imported by the users also.